Quality Control of Mean Temperature Measurements of DoM/WMO stations in------------------------------------------Sri Lanka |
A Brief description Quality assessment of mean temperature data at a near equatorial location such as Sri Lanka is challenging given the limited seasonal variability. Annual temperature in stations other than those in the hills such as Nuwara Eliya, Diyatalawa, Badulla and Kandy ranges between 22 and 29 oC. The inter-annual variation at all station is less than 2 oC. Here we attempt to build reliable and more complete set of station mean temperature data for Sri Lanka. In addition, where the data does not pass quality control, we will attempt to reconstruct the discarded or missing data using neighboring stations records |
|
| Click on the image to Zoom ---[to top] |
Quality Evaluation of Historical Mean Temperature Data in Sri
Lanka
Introduction
Analyses of historical variations of instrumental temperature
records are important for many purposes including the investigation of regional
effects of global warming. Such analysis is particularly important in locations
with long and dense historical data such as in
Data from eleven out of the fifteen stations have been incorporated into the Global Historical Climate Network (GHCN) database .Quality control has been carried out based on a globally applicable guidelines and suspect portions of the data have been omitted.
Quality assessment of mean temperature data at a near
equatorial location such as
Here we attempt to build reliable and more complete set
of station mean temperature data for
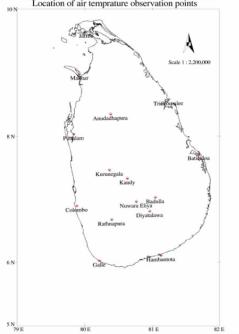
Stations that were used in the analysis
Station Name������������� Latitude(oN)���� Longitude(oE) Elevation(m)��� Duration of Record
Jaffna������������������������� 9 39���������������� 80 1���������������� 4��������������������� 1871-1994������
Mannar����������������������� 8 59���������������� 79 55 ������������� 4��������������������� 1870-2000������
Trincomalee��������������� 8 35���������������� 81 15 ������������� 3��������������������� 1866-2000
Anuradhapura������������ 8 21���������������� 80 23 ������������� 93������������������� 1870-2000������
Puttalam��������������������� 8 2������������������ 79 50 ������������� 2��������������������� 1869-2000������
Batticaloa������������������� 7 43 ��������������� 81 42 ������������� 3��������������������� 1869-2000
Kurunegala����������������� 7 28���������������� 80 22�������������� 116����������������� 1885-2000������
Kandy������������������������� 7 20���������������� 80 38�������������� 477����������������� 1869-2000������
Badulla����������������������� 6 59 ��������������� 81 3���������������� 670����������������� 1869-2000������
Nuwara Eliya�������������� 6 58 ��������������� 80 46�������������� 1895��������������� 1869-2000
Colombo�������������������� 6 54� �������������� 79 53 ������������� 7��������������������� 1869-2000
Ratnapura������������������ 6 40� �������������� 80 25�� ����������� 34 ������������������ 1969-2000
Hambantota��������������� 6 7 ����������������� 81 8���������������� 16������������������� 1869-2000
Galle��������������������������� 6 2 ����������������� 80 13�������������� 13������������������� 1869-2000
Diyatalawa����������������� 6 49���������������� 80 58�������������� 1248��������������� 1901-2000
Methodology
The following analysis was carried out:
- Exploratory data analysis was carried out on the time series to check for errors in transcription and data entry. The annual temperature time series for the different stations was constructed and its histograms, mean, variance and extreme values were examined. The time series was also examined for mean temperature values that exceeded 3 times the inter-quartile range. Such data was removed unless a similar anomaly was replicated in neighbouring stations
- An average �All Sri Lanka Temperature� (ASLT) series was constructed. A cross-correlation table was constructed of the mean temperature records of the15 stations and the ASLT.� In addition, correlation tables were constructed for parts of the record (1869-1894, 1895-1919, 1920-1949 and 1950-2000). When the correlations were lower, even smaller intervals were tested to see whether there was any correlation.
- The temperature variation at each station was reconstructed based on the data at the five stations that had the highest correlation during the years from 1900-2000.
The reference time series were estimated as �
![]()
![]()
where
![]() �� -� Standardized anomaly for jth
year
�� -� Standardized anomaly for jth
year
Resultant
weight for the ith station� ![]() �is given by
�is given by
![]()
Here
![]() ���� -� Correlation between the station and the
ith surrounding station
���� -� Correlation between the station and the
ith surrounding station
�����
![]() ����-� Number of data used to derive the
correlation coefficient for ith station
����-� Number of data used to derive the
correlation coefficient for ith station
Years that showed significant discrepancies between the observed and reconstructed was identified as suspect. Based on a comparison of the observed and reconstructed data and the lack of any relationship between the observed and reconstructed data, data for the suspect period was discarded.�
4.�� Site-change effects were estimated using the cumulative sum technique� by the difference between the target station and weighted mean of neighbouring stations and monthly temperature values were adjusted.
Results & Discussion
Exploratory Data Analysis
Outliers: The outliers in the time series and histograms were identified and the data was checked from the various sources, such as the Department of Meteorology archives, the GHCN archives, reports of the Colombo Observatory, the Department of Meteorology and the reports to the Colonial office. In most cases, the data from the different stations were consistent but there were exceptions, which were corrected for. Even after these corrections, there were still outliers which were beyond a threshold of thrice the Inter-Quartile-Range of the distribution and which were identified as suspect. These were Jaffna and Ratnapura (1896), Galle and Hambantota (1901), Nuwara Eliya (1997) and Anurhadhapura, Batticaloa, Badulla, Galle, Hambantota and Diyatalawa�� (1998).��
Cross-Correlation
In summary, the data� whose correlation with ASLT were below 0.3 are listed below.�
Jaffna ������������ 1869-1894 (-0.1), 1981-2000
Puttalam��������� 1894-1905 (-0.23)
Batticaloa������� 1869-1880 (0.10), 1895-1905 (-0.16)
Hambantota��� 1869-1880 (0.28), 1895-1905 (-0.15)
Rathnapura�� � 1869-1880 (-0.30)��
Comparison of Data with Reference Time Series
The comparison of annual temperature at each station and the reconstruction of it using data of other stations that shows the highest correlation with it helps identify shifts in locations of the station, calibration errors and declines in quality of the data.�
References
Thomas Peterson.� The Global Historical Climatology Network (GHCN).
http://www.ncdc.noaa.gov/cgi-bin/res40.pl?page=ghcn.html
D.A. Rhoades and M.J. Salinger. 1993.� Adjustment of temperature and rainfall records for site changes. International Journal of Climatology.� 13:� �899-913